I recently went live in Facebook to drop a “Knowledge Bomb” about the importance of reading stock charts and being able to analyze if charts are bullish or bearish.
I have heard a few people say that “the stock market is a scam”, and obviously these ones are not involved in trading. What I find is in life in general and in the stock market, when people are making money outside of traditional means, it is not that it is a scam, but that someone knows something that you don’t know. And once you gain the same information, you start making educated decisions.
I teach about the stock market, not to “share stock picks”, but to really educate on how to read the charts, recognize patterns, and understand set ups.
In this live video, I give you some information on how to do just that.
The S&P 500 – Spot the Uptrend
I start out this video with sharing my screen and looking at the S&P 500. The S&P 500 is the collective 500 stocks that make up the US Stock Market – it isn’t always exactly 500 stocks, but it stays around that number.
How does this relate to recognizing patterns and seeing indicators for when the best time to buy and sell is?
We zoomed out to July 1988, and analyzed the price from way back then to now. The overall market at that time was $300 per unit or share. This is representation of the overall US economy.
Today, in August 2017, the market closed at $2,447. In simplest terms, the market is up today.
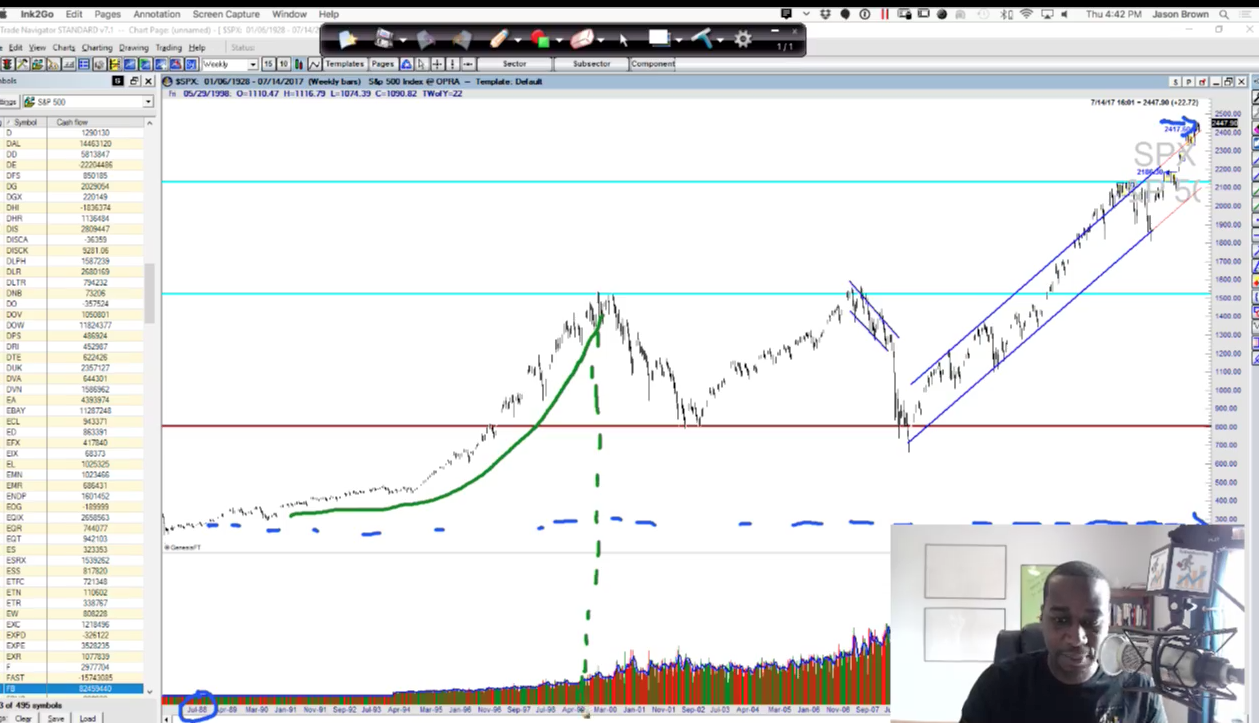
The market had a nice run from 1988 to 2008. In 2007, the market started to tank and 2008 is when President Obama took office. Also around that time, the housing market started to crash, everything was down. Also around that time the news was telling you to “sell” and “get out!”.
If you don’t know how to read charts, you may have. In 2008 and 2009 the market bottomed out, the buyers and bargin hunters, and those who understand it will not last forever, started buying it up.
The trend from then until now is up. If you knew how to read the stock chart back then, would you have put about $600-$700 in knowing that it would now be worth $2,400? That’s about 340% increase. Not a bad return at all.
But here’s the thing: When you don’t know how to read a stock chart, you don’t know when a good time to buy or sell is.
Now the market is in the “winner’s circle”. In between those times that the market has gone up, there are sideways actions. But it always results in a breakout.
The market never moves up in a straight line, but over time, the market is overall up
It goes up, sideways, sell-off, then up again. But it is definitely in an uptrend at this time. Should your money be in it for the long term for the ride?
Uptrends: Facebook Chart
Facebook first came on the scene in the stock market May 18th, 2012. It immediately sold off, and then it went sideways, and then started an overall uptrend.
Now we see what we learned from the S&P 500, there was a moment it bottomed out, but then went in a longterm up pattern. If you saw the pattern, you could have bought it at $25 and now it is worth $159. When you look at this pattern, did it go straight up? No – it went sideways for periods. It stair-stepped its way up.
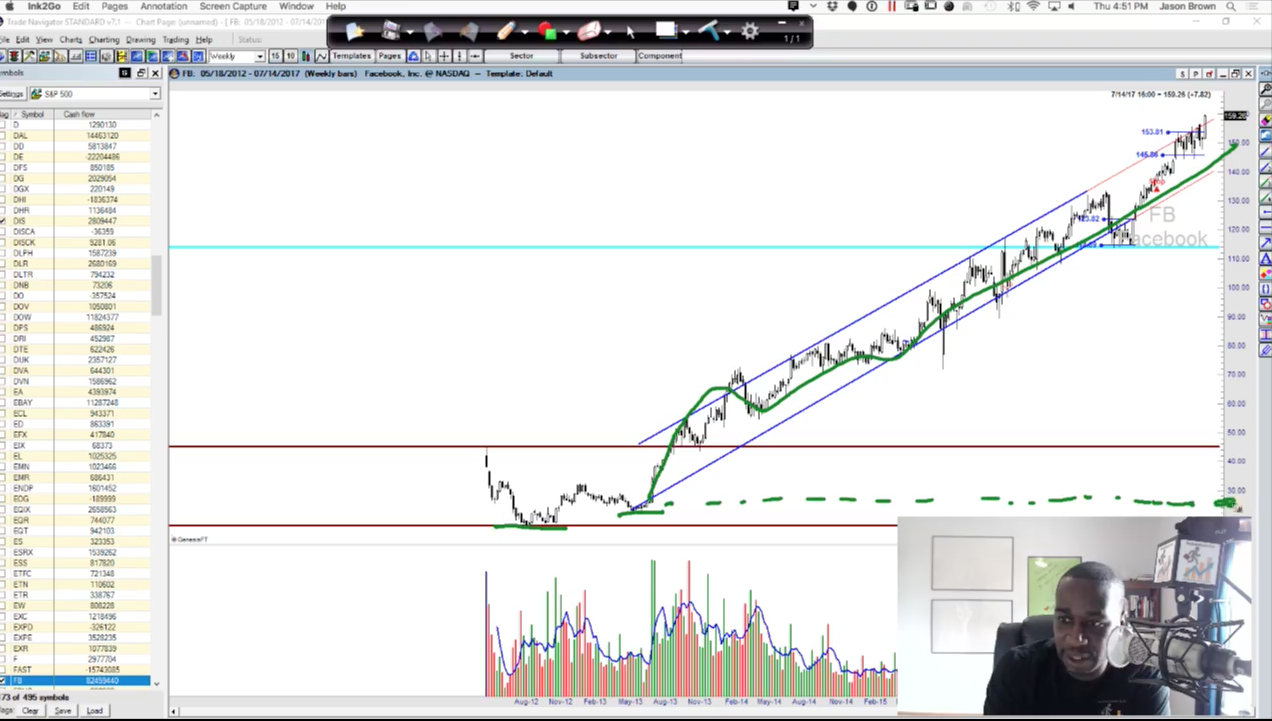
If you understand how to read the chart, you can spot this pattern, recognize patterns that are going higher, and buy at that time. This is just a high-level overview, there’s more detail than just that, but this shows why it is important to be able to read a stock chart and determine if it is in an uptrend or down trend.
Downtrends: Bed, Bath & Beyond Chart
We have seen how stock charts look when they are doing well. But as for an example of one that is not doing well, let’s look at Bed, Bath & Beyond.
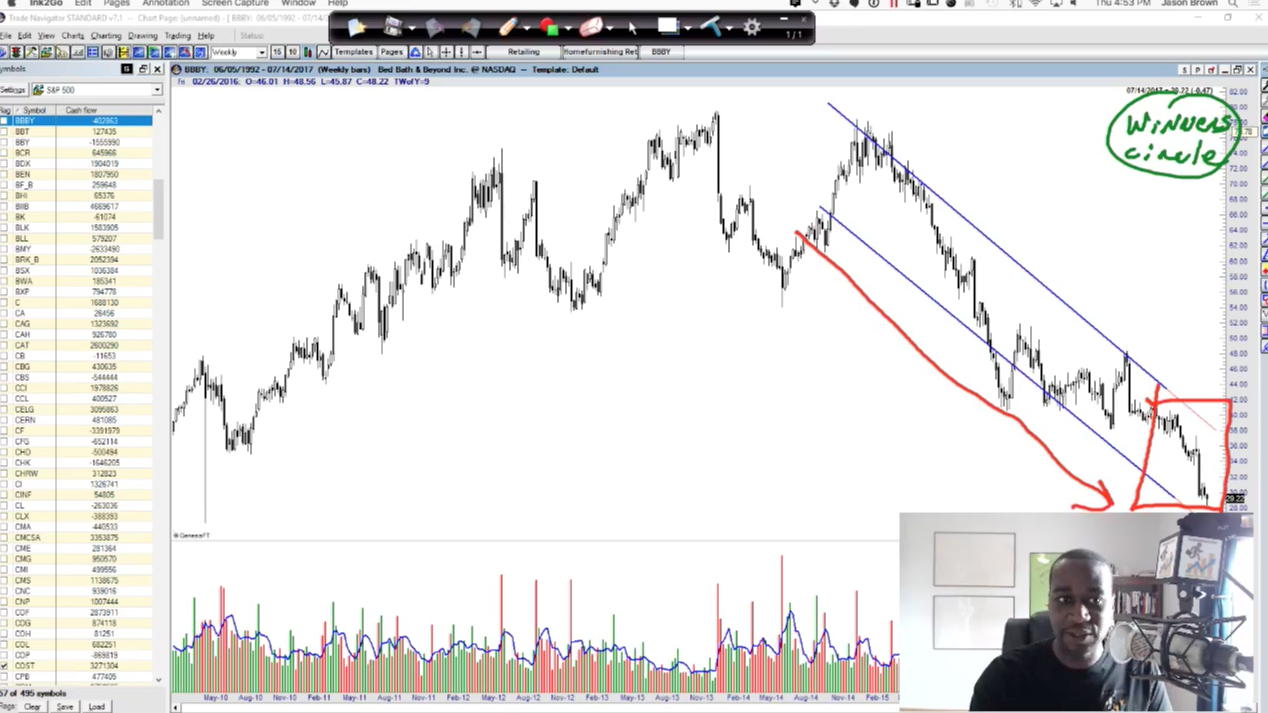
They are in what we like to call the “penalty box”. It continues to loose value. Most people say “hey it’s a good time to get in”. But from looking at the chart, it saves you a lot of heartache from going in at this time.
Apply this to your life
If you take this information and apply it to your 401K or your trading, it will allow you to take control and understand what is going on. 401K have charts that you can look at, and you can analyze if it is in the “winners circle” or the “penalty box” – just that will change the way you allow your money to be directed and make smarter decisions.
There are other ways to make money – even off of downtrending charts, like Bed Bath & Beyond. Yes, you can make money off of stocks that are doing badly – if you know how and when.
Step 1 should be to make sure you know how to read a stock chart before you apply a strategy.
You can make better decisions just by being knowledgable about stock charts
If you want to continue this education about how to read stock charts correctly to improve your financial future, feel free to take one of my free webinars or take a look at my Foundations of Stock Trading course.
Comment below if this information was helpful to you, and be sure to connect with us on Facebook to never miss our Facebook live sessions.
4 replies to "Facebook Live: The Importance of Understanding Stock Charts"
Great stuff man! I’m reading everything you put out. Thank you so much for sharing!
the market crashed.
listening. Chicago
Jason… Thank you!…so very much for the “Understanding Stock Charts” Facebook training, the info was vital and enlighting… as well as the traning info in (4 Steps to Determine how much money I need to start investing) but can I open an account with a minimun amount, so as to become formuliar with the “trading platform” via (VITURAL TRADING) and add a remaining amount when I (think) I’m ready to go LIVE…?