Mastering TradingView: The Ultimate Customization Guide
We're diving deep into how to fully customize your TradingView charts. We'll walk through step-by-step how to personalize every aspect of your chart settings, from ticker symbols and status lines to background themes and economic event indicators. If you're new to TradingView or just looking to optimize your trading setup, make sure to tune in and join me for part two where we learn how to set up technical indicators.
Create a free or paid account with TradingView: CREATE AN ACCOUNT HERE
Video Time Stamps:
[00:00:30] Starting in TradingView and Where to Customize Settings
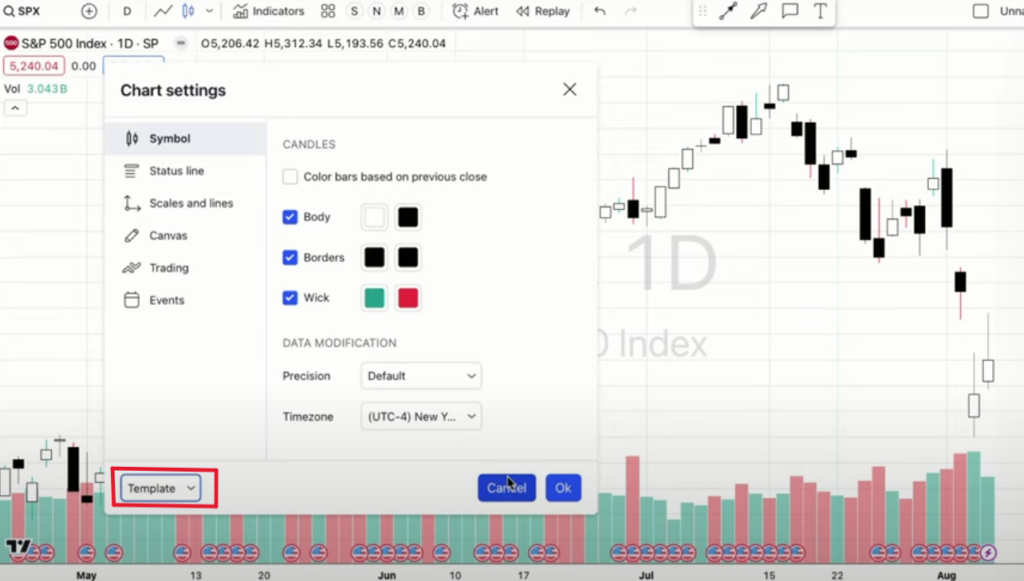
[00:01:13] Changing Chart Type and Colors
[00:02:09] Changing the Candlestick Colors
[00:04:05] Status Line Customization
[00:05:24] Chart Values and Indicators
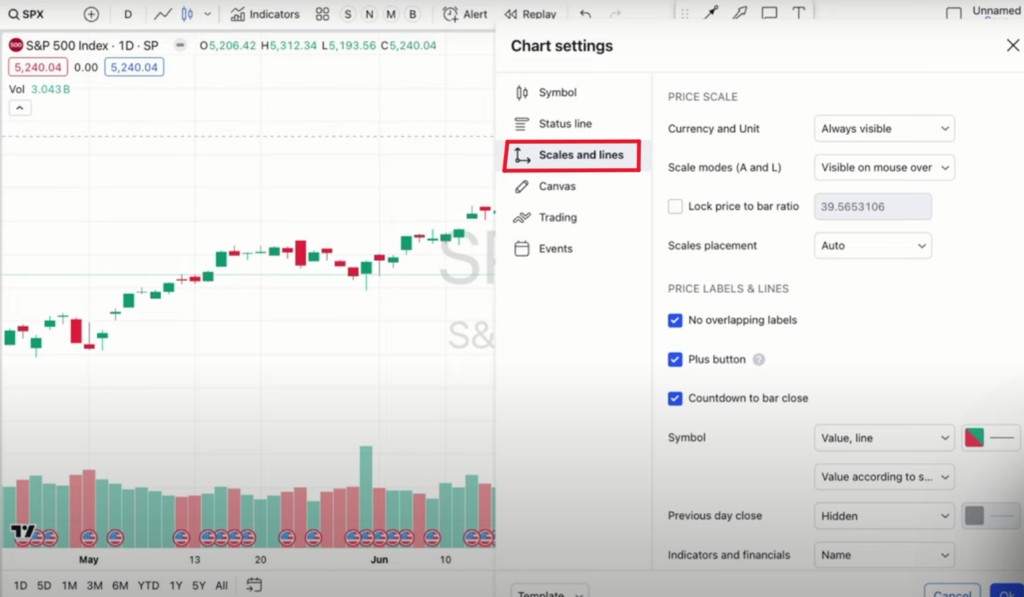
[00:08:08] Scales and Units
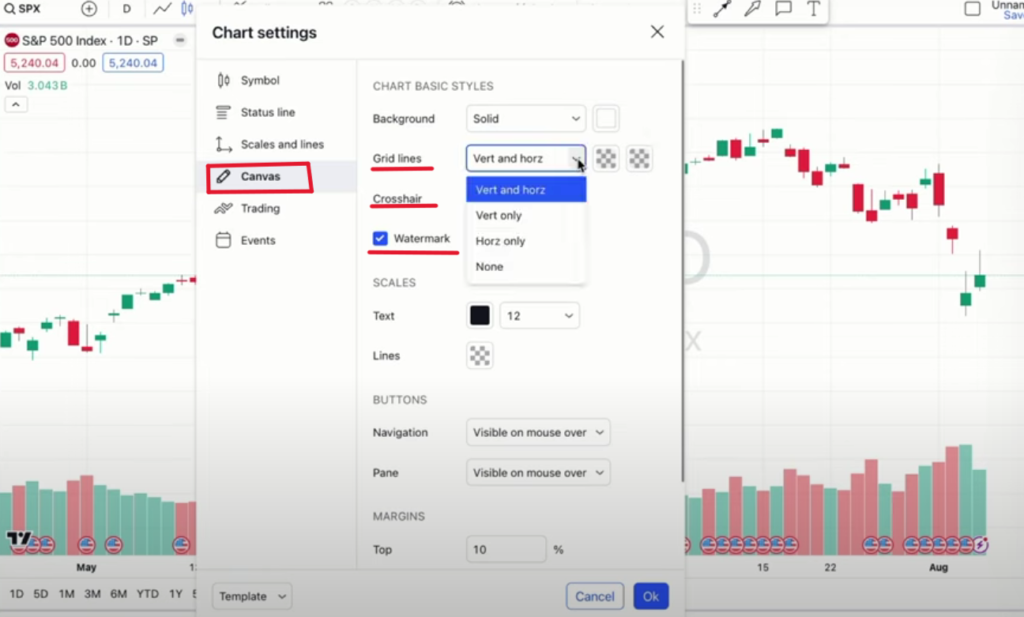
[00:12:12] Canvas Background
[00:12:46] Grid Lines and Crosshairs
[00:13:28] Watermark
[00:15:04] Trading Options/Placing an Order
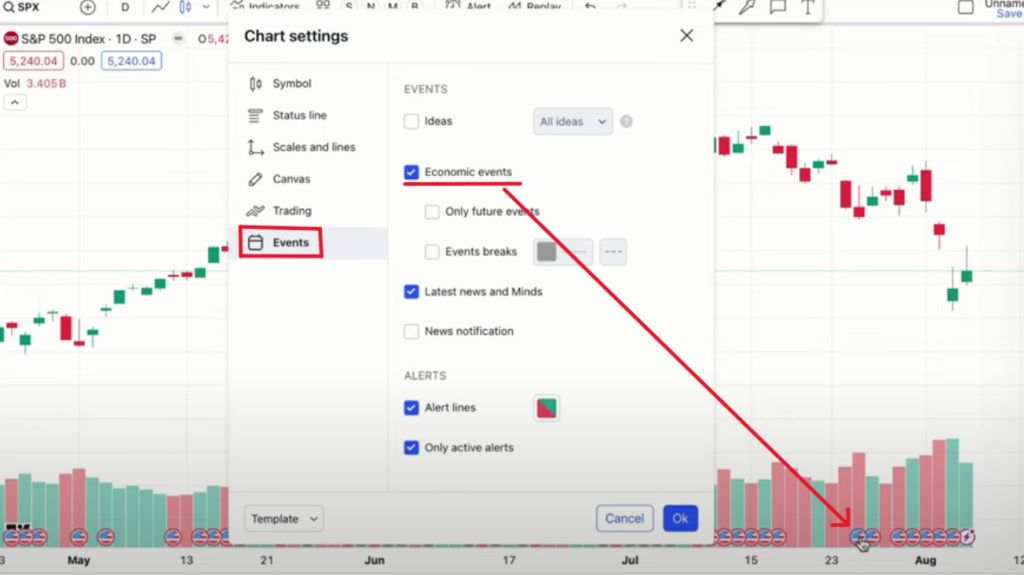
[00:15:52] Economic events
[00:17:49] Saving Templates
[00:18:06] Additional Resources
Setting Up Your Chart in TradingView
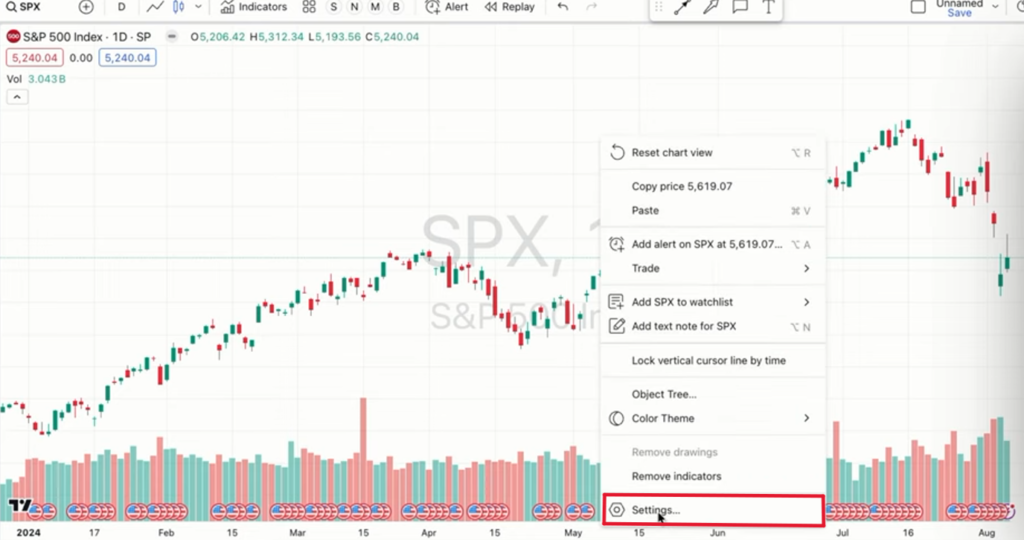
To begin, load up TradingView and select the SPX ticker symbol, which represents the S&P 500 Index. Right-click on the chart and scroll down to "Settings." This menu is your gateway to fully customizing your chart. You can even move this settings window around if it obstructs your view, ensuring you can always see the changes you make in real-time.
Chart Type
- **Candlestick Chart**: Offers detailed visuals, showing opening, closing, high, and low prices.
- **Line Chart**: Simpler, displaying just the closing prices over your selected time frame.
Colors
With a candlestick chart, you have more options for customization than with a line chart. For example, you can change the color scheme for better visual clarity:
- **Positive Days (Up Days)**: Change to white if you find red and green too Christmassy.
- **Negative Days (Down Days)**: Change to black for a stark contrast.
Additionally, you can adjust the borders and wicks of the candlestick to match your preferred color scheme, enhancing readability.
Status Line Customization
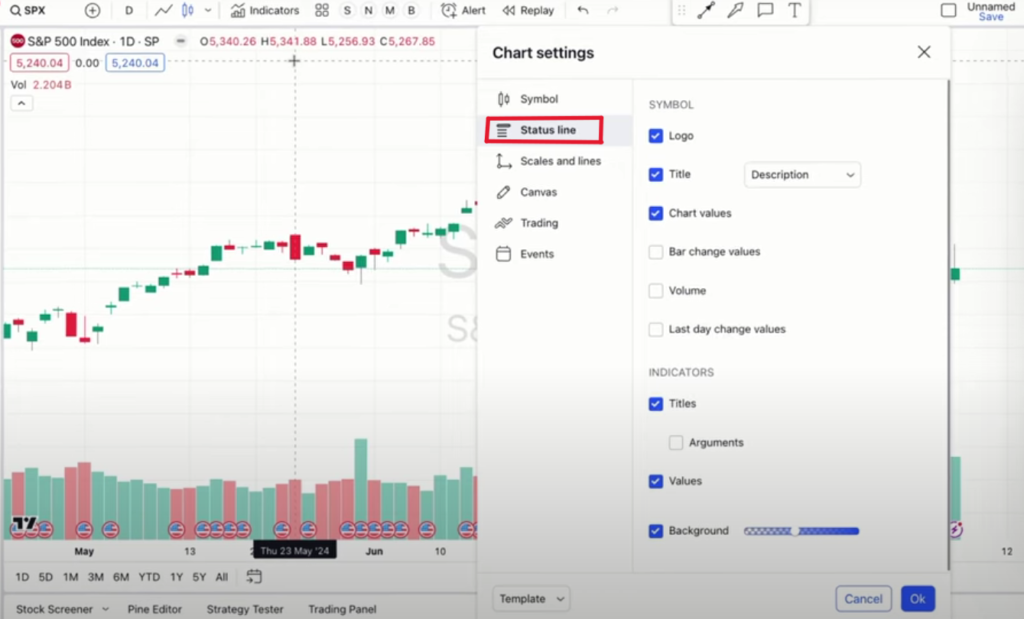
The status line is the section at the top of the chart providing essential information about the stock. You can choose to display the company logo, ticker symbol, description, or a combination of these. Personally, I prefer to show the description as it provides comprehensive details without redundantly displaying the ticker symbol.
Chart Values and Indicators
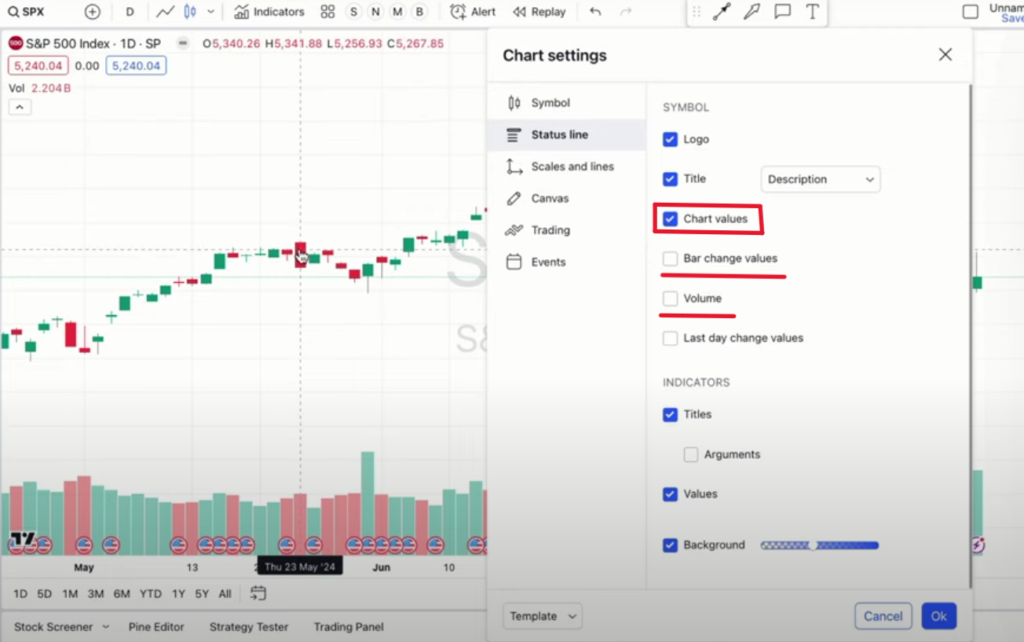
Hovering your mouse over the chart reveals several values such as the open, high, low, and close (OHLC) of each candlestick. You might also see percentage changes and volume, which you can opt to relocate or remove depending on your preferences.
Scales and Units
You can choose to have your currency and unit always visible, which is particularly useful for traders dealing with forex or crypto. Set alerts in your chosen currency without having to adjust visibility settings constantly.
Adding Alerts and Events
The plus button allows you to quickly add an alert to your chart. You can also display economic events, such as GDP growth or personal income reports, to stay informed on broader market impacts.
Canvas Background and Overlays
You can change the chart's background to a gradient or solid color. Some traders prefer a dark theme to reduce eye strain, especially if they often trade at night.
Saving Your Customizations
After setting up your chart just the way you like it, remember to save it as a template. This way, you can quickly switch between different layouts - such as daytime and nighttime themes or specific settings for various strategies.
Where To Go Next
Mastering the customization features in TradingView can significantly enhance your trading experience. From adjusting colors and layouts to setting up critical alerts and economic events, these tweaks make the platform work for you. Make sure to check out part two of this trading view tutorial, to learn how to set up technical indicators next. CLICK HERE to check it out.
