One of the most common questions asked is – “How do I set up a paper trade account?”
The answer is here!
Whether you are a new trader who is just getting started or an experienced trader, I am going to give you a step by step tutorial of how to use the “Think or Swim” platform inside of TD Ameritrade.
Getting Started
The first thing that you are going to do is go to www.TDAmeritrade.com
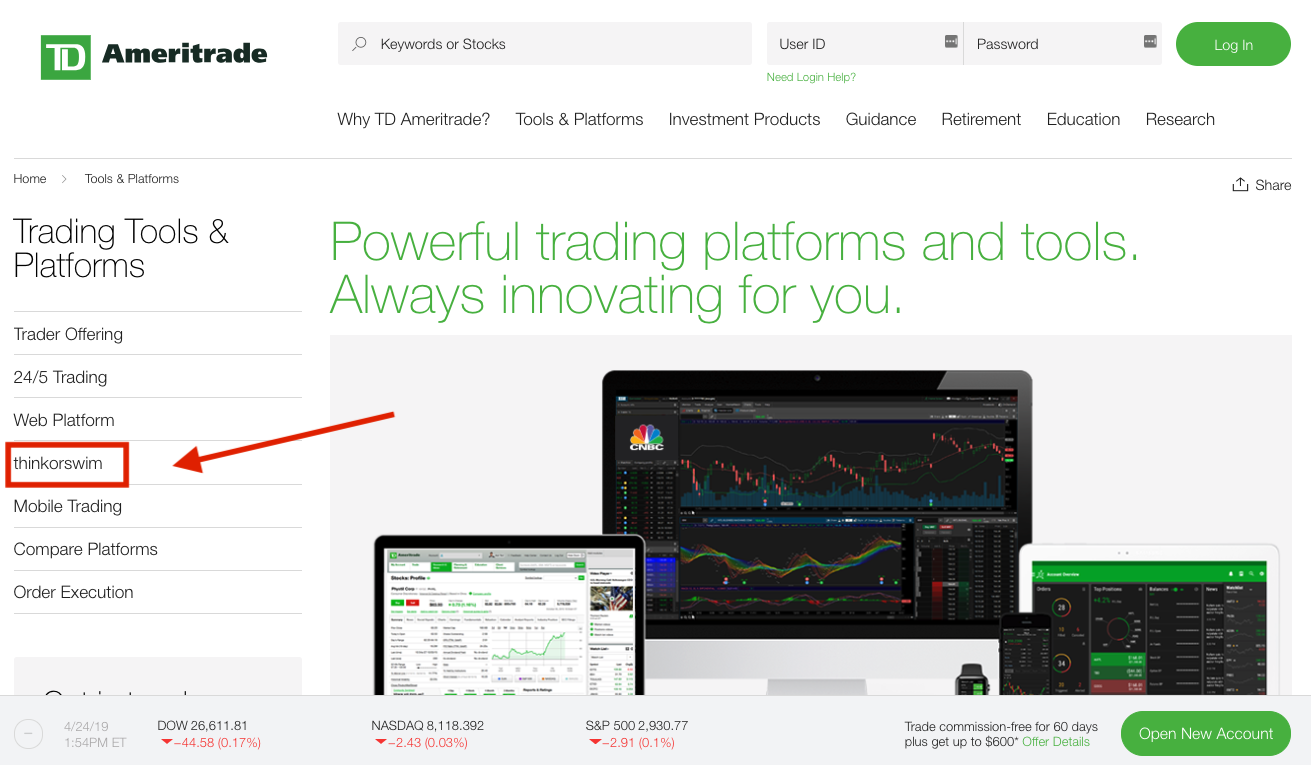
If you have an account, enter your information in the upper right-hand corner and click the green button “Sign In”.
If you do NOT have an account yet, click the “Tools & Platforms” option in the menu. On the lefthand side, you will be able to select the “thinkorswim” platform.
Once you open an account with them, you want to download the “thinkorswim” application right onto your desktop.
If you are going to be using the paper trading version (this is for practice trading only), be sure to open that version. It will ask you to login or create your account.
Once you have downloaded the platform onto your computer, you can chose between a real account or your practice trading account with the “toggle button”. You can easily switch back and forth from your real and paper trading accounts.
To get started, let’s show you how to use the paper trading account. Chose the “paper trading” side on your platform.
Remember, the real version will look the same, too. So make sure you are in the paper trading account.
Once you open your account, you will be taken to the dashboard shown below:
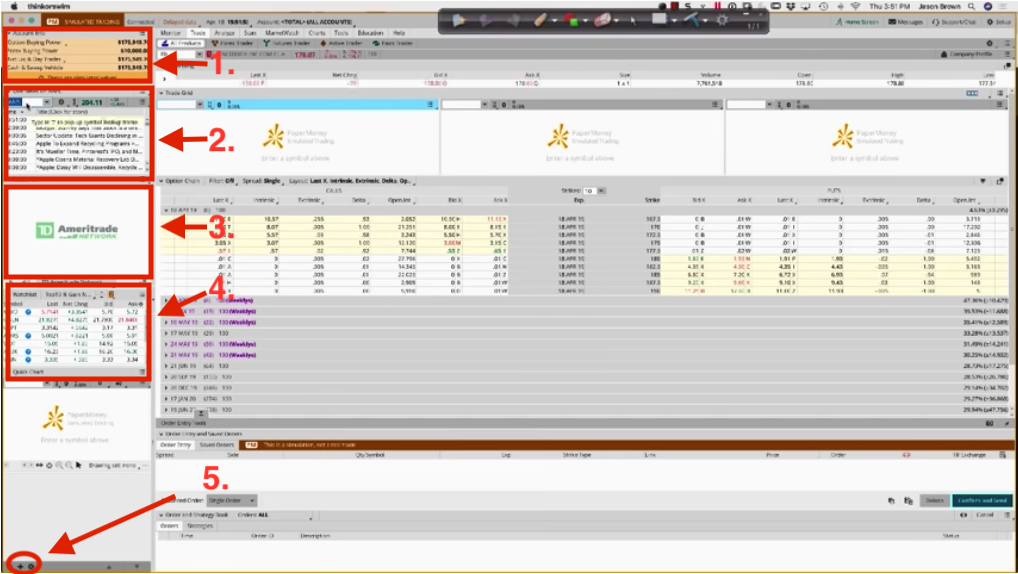
- On the top left hand side – you can see in orange the buying power you have.
- Right below that, you can research any stocks you may be interested in to see news. You can type in the ticker symbol and it will give you the top news items for that stock at this time. If you click the article, it will open in a new pop-up box.
- Right below that on the lefthand side – you can actually watch a news channel, including CNBC, live.
- Going down again you can see your own watch list.
- If you want to add something more to your dashboard, click the “+” in the lower lefthand corner to explore the different gadgets they have. You can also delete the gadgets that are already on your dashboard by clicking the button in the top righthand corner of each gadget and selecting “delete”. To just minimize the gadget, click the down arrow in the lefthand corner of the specific gadget.
Now let’s move over to to the tools on the top bar

Click the “Trade” Button at the top. Here is where you can enter your ticker symbols of what you are considering trading, and is probably where you will spend most of your time. You will be able to see the bid/ask price and the current price of the stock.
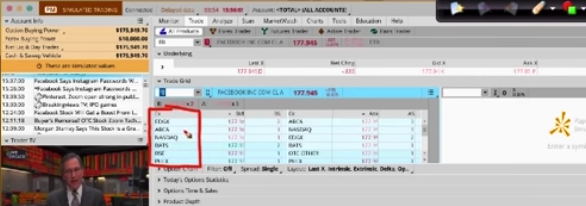 If you click “underlying” – you will be able to see the specifics a lot better. You also will see all of the exchanges that trade is being traded on (not just the NYSE).
It also shows you the bids – or how much people are wanting to buy and at what prices.
In the middle, you will see all of the option trade possibilities, which is great for option traders (like me). On the left hand side you get calls, and on the righthand 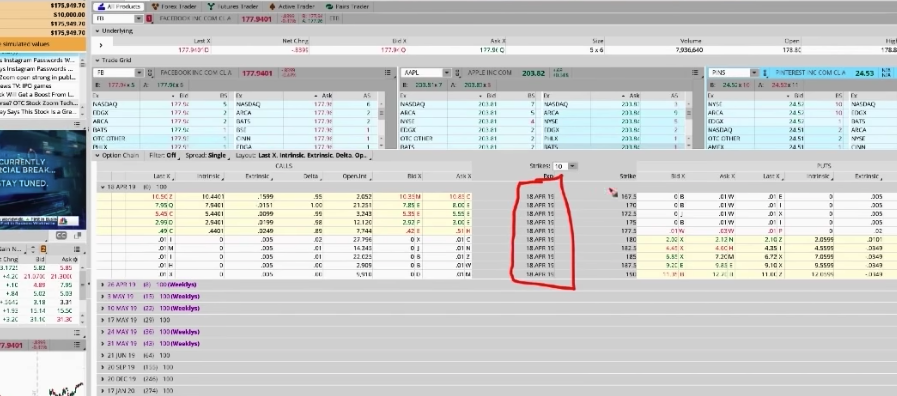 side you get put options.
Right below, you can check out the different expiration dates you can get with the option chains.
Setup & Layout
If you click the top righthand corner button called “Setup” – you can set up your dashboard. Then click “Application Settings“.
A pop-up display will show.
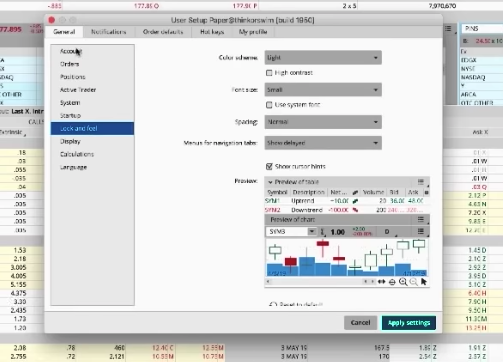
This will enable you to edit all of your settings. If we drop down to “Look and Feel”, you can switch it to dark mode, change your font size, spacing, etc. Then hit “apply settings“.
For my option chains, I like looking at the intrinsic and extrinsic value, as well as the last price.
I also like having the delta, open interests, the bid, and the asking price.
To change all of these settings, click the “layout” button right on the dashboard near the option chains.
You can click “customize” to select what you want in your option columns. Keep in mind, the more things you add the more cluttered it will be.
Buying an option
If you are ready to buy an option from a certain expiration date chain, just right click on it. The window will pop up which type you would like.
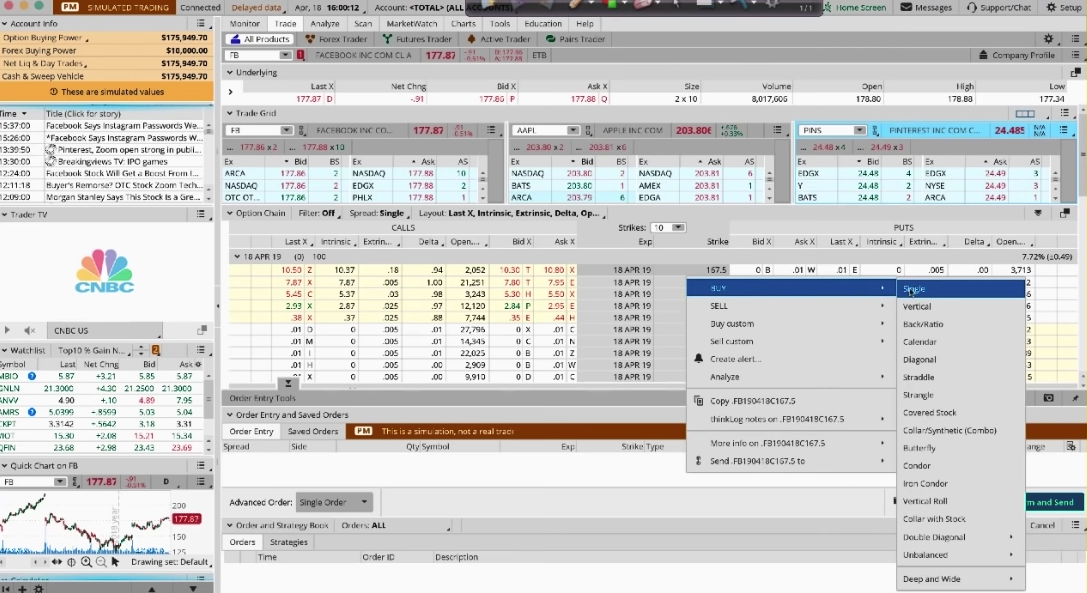
You would then select the option that you would like to BUY or SELL from the list.
Your order will then be plugged into “order entry” on your dashboard. You can then change it from buy to sell or vice versa if you need to, as well as confirm all of the information about your order.
You can select the amount of shares by moving the “share” arrows up and down. If you need to adjust or change anything, you can do so right on the dashboard in your order entry. When everything is correct, you can click the “confirm and send” button on the dashboard. After your final review, you can place the trade by clicking the “send” button.
Monitoring your trades
Once you have placed your trades, you can monitor them. On your dashboard in the top lefthand corner, click the “monitor” tab.

If the order is working but hasn’t yet been filled, it will be under the “working” tab. If it has been executed, it will be under the “filled” tab. Obviously if you have cancelled a trade, it will roll down to the “cancelled orders” tab. If you have an open position that you are rolling out to a different month, it will be under the “rolling” tab.
Looking at charts
You can also take a look at different stock charts with their charting software. On your dashboard, click the “charts” tab. Then type in the ticker symbol you are wanting to look at.
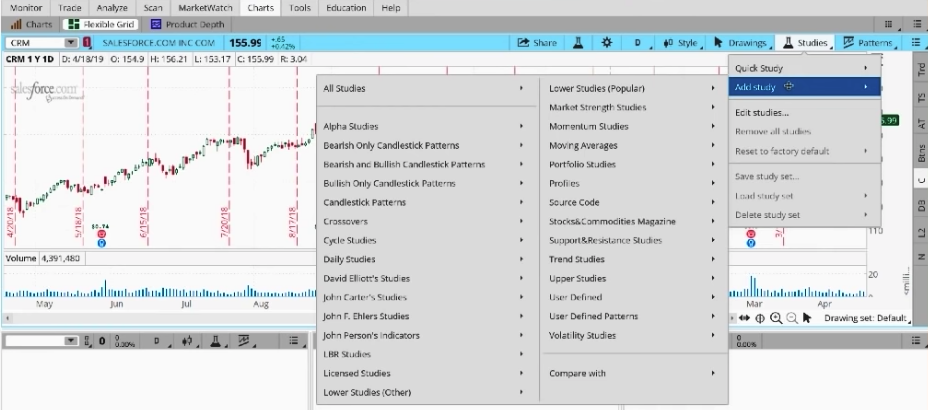 Inside the charting software, you can switch it back and forth from a line chart to candlestick chart by clicking the “style” button.
You can also add pre-built studies to your chart under the button “studies“. Then you can add things like bollinger bands and moving averages onto your chart.
On the bottom, you can view multiple charts at once. This is helpful to quickly compare.
If you hit the “trade” button on the side – it will give you a super quick way to trade the chart you are on. I don’t necessarily recommend this option, you would have really needed to have done all of your research prior to making that move.
If you click the settings wheel icon in the righthand corner of the chart, you can change the settings for how you view the charts and what you would like to have on your dashboard.
That is just a quick overview of how to use a paper trade account OR real trade account right inside ThinkorSwim platform, part of TD Ameritrade. Feel free to comment below if you enjoyed this tutorial or also use the platform.
If you are a newer trader and would like to learn more about trading options, you can register for my free 1-hour options trading training by clicking here.
