Is it REALLY possible to make money from stocks FALLING? Absolutely.
But don’t just take my word for it… In this live case study replay, I break down how it is possible to make money on falling stocks. Get the breakdown and analyzation of how a put option works, and why with this particular stock I was able to lock in 47% profitable return. This is a real trade with my real trading account.
*Disclaimer: trading in the stock market involves real financial risk. By showing this case study, Jason Brown or The Brown Report LLC is not guaranteeing that you will make these types of returns.
Put Option Break Down
First things first: it is important to remember that no matter how much money you are trading with, what matters is the percentage. As I walk you through my personal numbers, I may be trading with a larger account. No matter what though – 47% return is a 47% return. Focus on the percentage, not the actual numbers.
Stock that I traded: CAR
Initial trade entry: 8/30/19
Initial trade cost: $55,995.24
TOTAL PROFIT: $25,995.24, 47% return
Initial Analysis
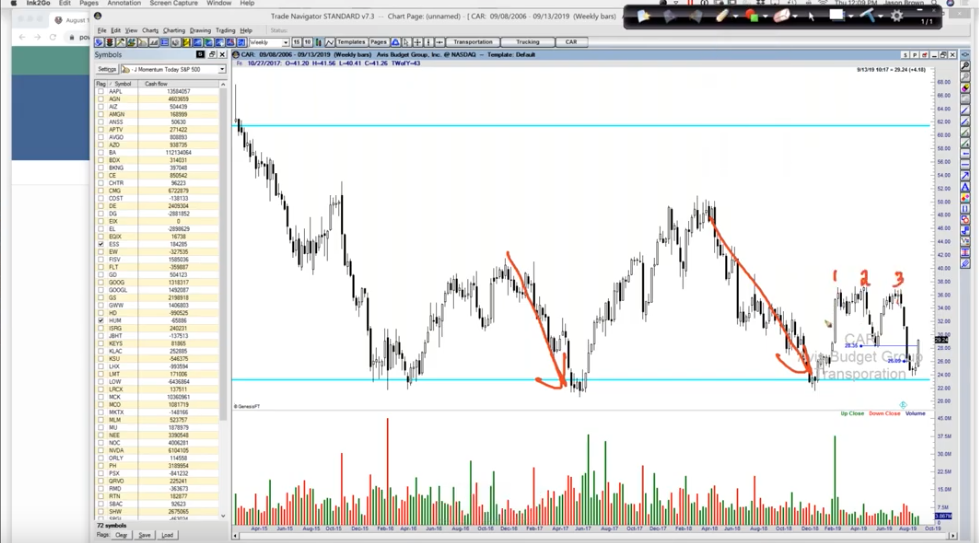
When we first found the trade CAR, we were able to analyze a few pull backs and a triple-top, pictured below. Each time the stock tried to run up, it got smacked down again. This happened 3 times.

This same pattern happened before (where the big red arrows are shown).
Pattern recognition is a HUGE part of this game. You have to be able to see where a stock could potentially go based on it’s previous history.
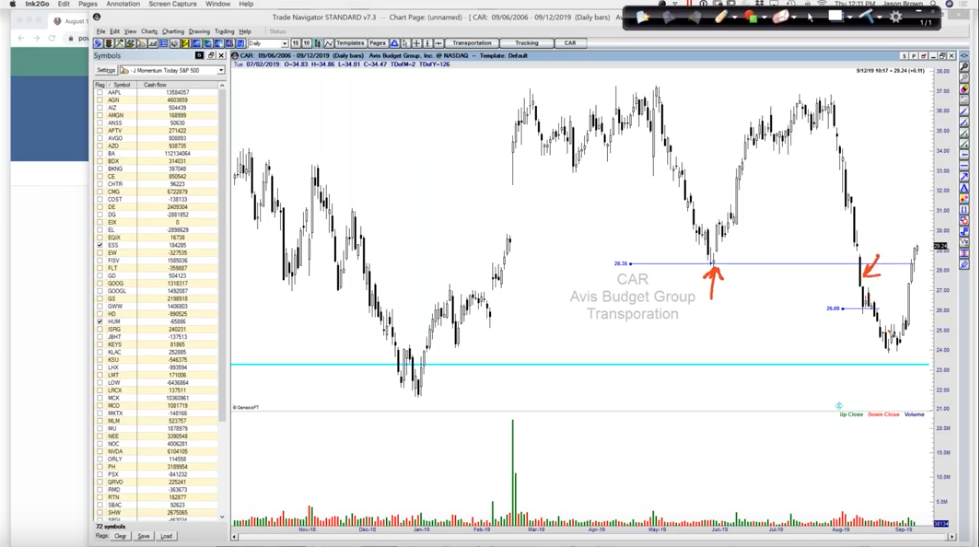
When we discovered this pattern inside one of our live sessions inside of Power Trades University, the members and I made the analyzation that we would wait until CAR confirmed that it would break through it’s support line, as shown below.

When it did what we thought and broke through the support line, we had the opportunity to take a position for a short term put option.
Entering the Trade
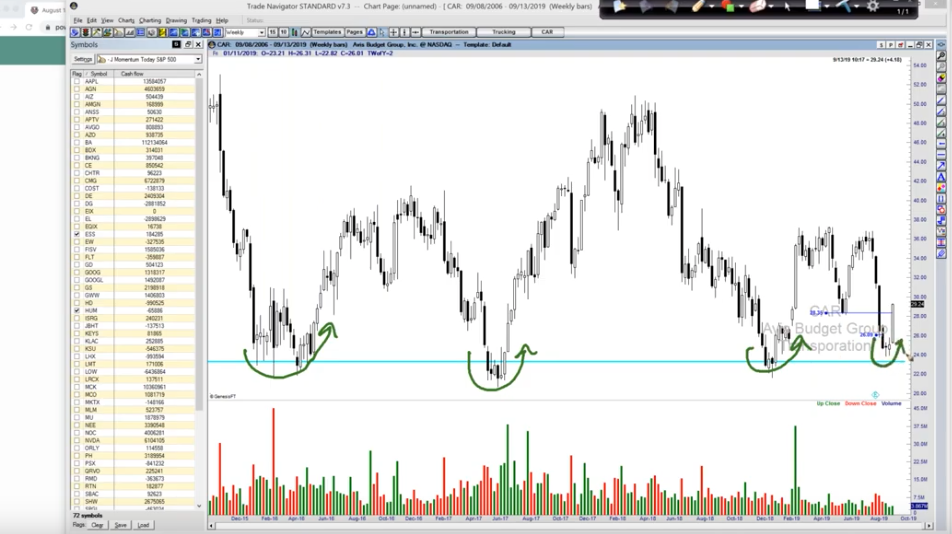
All of the members have to make their own trading decisions based on the chart analysis, and I decided to move forward with the put option. With our analysis, we were able to detect that the stock could fall all the way down to $23.50. And it ended up doing nearly just that – it fell all the way from $28.75 to $23.80. That’s just .30 cents away from our target.
From the chart, we knew that that was the time to get OUT because then the chart proved that the stock turns around and then that would make our put option into a loss. That’s picture below by the green arrows.

Based on the chart, we were able to see clear ENTRY and EXIT points.
That is so key in being able to making large returns like we did – not only being able to analyze where to get it, but also at which point to lock in profit and run.
Those who decided to enter the trade, like myself, entered the trade on 8/13 and exited on 8/27. I got the $33 put option, meaning when I sold the contract at $23.80 I really made off with the $33 price. In only two weeks, I was able to make a 47% return on a stock FALLING. That is the power of Put Options! And the power of being able to read the chart.
If you are unfamiliar with put options… then I highly recommend taking a look at the resources below.
-Podcast/blog post: What Are Options And Why Do They Matter to You? Click here
-Podcast/blog post: What Are Put Options and Do They Really Work? Click here
-Course and membership: Options Explained and live weekly Group Coaching sessions to find other potential trades like the one broken down above. Click here
What I want you to walk away from this case study with:
It IS possible to make money from a falling stock! We proved it, we did it.
The KEY is being able to analyze the stock chart so you can not only figure out where to get in on a trade and see what the pattern says the chart is probably going to go, but also to see where your level is that you need to get out and lock in profit.
It is possible…. but now how are you going to make it possible for you? Start gaining the knowledge today. I encourage you to not sit on the sidelines, but check out the resources mentioned above.
