
100% Return Case Study: Pot Stock
I don’t personally smoke pot, but when the chart gives something good – the chart gives something good.
In this LIVE case study replay, I break down how the members inside of Power Trades University and I found this stock and made a 100% return in just 7 days.
As states begin to make pot legal, it provides a potentially great investment opportunity.
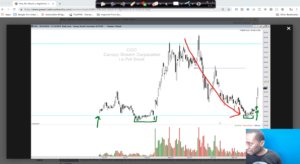
On January 10th, 2019, I gave the breakdown of this CGC stock to our members inside of Power Trades University, as you can see below…
I gave the chart analysis, which is what we look for every week in our two hour live Group Coaching sessions.
We were able to find that the pot stock CGC sold off to support on the chart, and we analyzed if we caught it right we expected a bounce here:
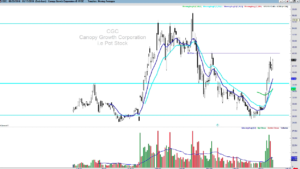
So we picked up the option trade for about $3.85. And the chart did just what we thought it would – it shot up. Today it is going for about $9.00.
That equals OVER 100% return in just about 7 days.
A lot of people in our community forum had a ton of success with this as well. It is incredible what you can find when you are able to read stock charts and recognize trends.
So while you may be sitting on the side lines right now, there are people actually making money off of this. If you are thinking about getting started… there are these types of trades happening all around us.
If you are looking for education on HOW to read these trends on the stock chart, I recommend going over to Power Trades University and checking out membership access. This is where you will be able to join me live every week AND inside the forums where we post potential opportunities such as this one.