Introduction to TradingView
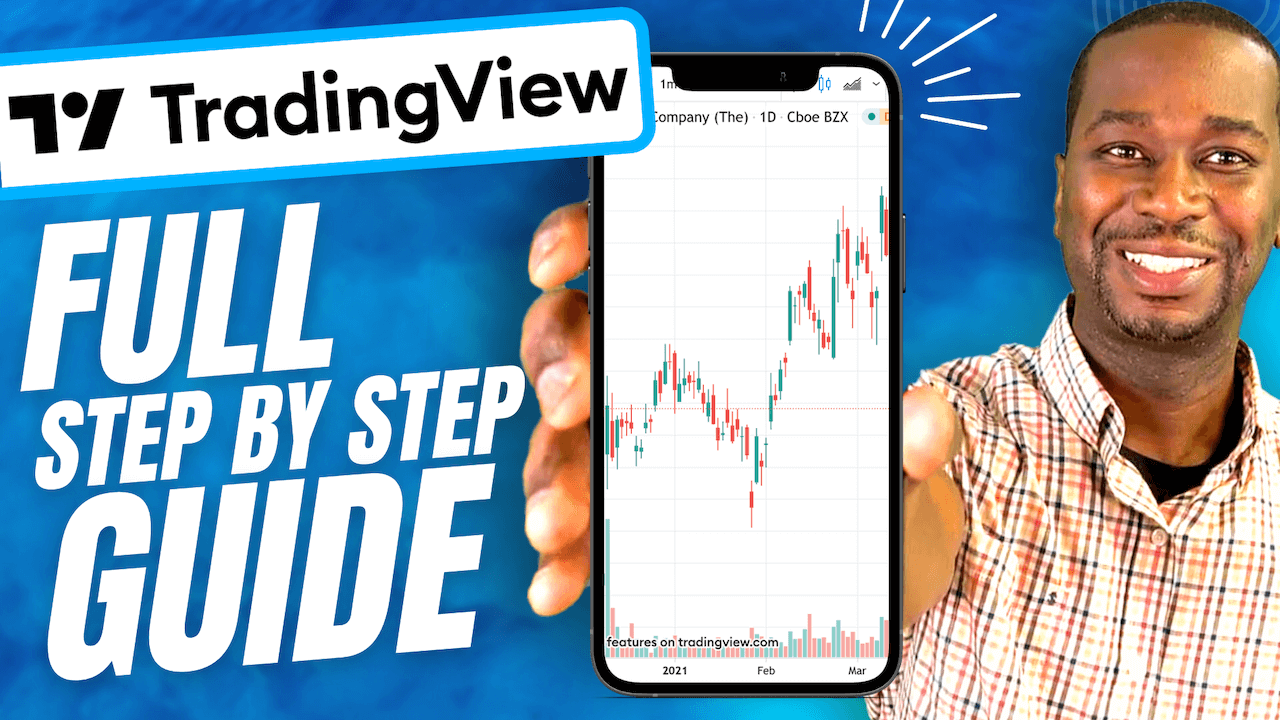
TradingView can be a great charting tool... if you know how to use it correctly. Let's break it down step by step how to set up your TradingView app. In this tutorial we're diving into the essentials of setting up charts on the TradingView mobile app. Whether you're a seasoned trader or just dipping your toes into the stock market, we've got you covered.
Download TradingView & Set up an account with them: www.TheBrownReport.com/TradingView
[00:00:25] - Download the App & Creating Watchlists

The first thing you need to do is download the TradingView app onto your mobile device.
If you have an Apple product, you can find it by typing in "tradingview" in the search bar and finding the app that looks like a black TV.
[00:01:25] - Setting Up a Watchlist

It will open up to your "Watchlist". In order to create a custom list, you will need to create an account if you haven't already done so.
From there, you can create multiple watchlists and add stocks to them. For example, I created "Bullish" and "Bearish" Watchlists. I added multiple stocks to each. You can edit each list as you go by deleting and adding stocks.
[00:03:33] - Setting Up Your Charts

In the tutorial above, I use ETSY as an example chart. The green indicator shows that the market is open, if the market were closed it would be red.
To change or edit your settings, go to the 3 dot icon in the bottom right-hand corner. This is how you can change the settings on your chart.
For example, you can change your time frame. If you are a day trader, you likely want to look at the 3-minute or 5-minute time instead of the daily or weekly chart.
If you are a longer term trader or investor, you would likely want to look at the weekly and the daily.
This is also where you can switch from a candlestick chart to a line chart. In the upper righthand corner, you can adjust your indicators.
With a free account, you have a limited amount of indicators you can use on your TradingView mobile app.
You can see how many you have in the upper righthand corner and click the drop-down menu. From there you can add and delete indicators, such as moving averages.
[00:15:45] - Setting Alerts
")
To set alerts, you can go to a specific stock such as AAPL (Apple) and click the alarm clock looking icon.
From there, you can chose your settings to what you would like to be alerted to, such as if AAPL rises or falls to a specific amount.
You can also set how many times you would like to be alerted and when.
[00:17:55] - Indicators & Drawing on the Charts
")
Right on the chart, you can add in technical indicators such as volume or specific moving averages.
To draw on the chart, hit the pencil looking icon. That will bring up your drawing tools, such as a trend line or trend angles. Once you select it, you can draw it, then double tap when you are done. You can also grab and hold it in order to move it around.
You can also add notes, which is helpful to include your analysis so when you go back to it you can quickly detect if the chart is doing what you expected it to.
[00:25:23] - News & Ideas Tab
")
There is also a news and ideas tab, which can be helpful when finding the latest news topics related to stocks you are following.
I would just offer a word of caution when it comes to the "ideas" tab. You don't want to blindly follow those on the internet so just make sure you have done your own research and know how to confidently read stock charts you're considering trading yourself.
I hope this helped you feel more empowered to using the TradingView app on your mobile device especially when it comes to configuring your charts and indicators.
[00:27:33] - Outro, Recap, and Where To Go Next
By now, the TradingView app will be less of a mystery and more like a trusted tool in your trading arsenal. If you're looking for more tips and tricks, tutorials, or "how-tos" make sure to check out the rest of my blog posts, where I help ordinary investors become experienced and educated traders.